June 7, 2023
R.O.I.: do companies investing in UX perform better?
Do companies that invest in UX perform better? Numerous studies have already shown the R.O.I. of UX, but the figures are getting old and don't include the digital responsibility of companies in their scope. We have therefore decided to make our contribution with a study dedicated to the R.O.I. of User Experience in 2023 in France and the United Kingdom.
PS: note that we haven't yet translated the charts. Contact us using the form at the bottom of the article if you're interested.
Methodology: an international survey of business decision-makers
The specificity of our approach is to compare the results of companies that do UX with those that do not. For this, we have drawn up a sample of 200 respondents:- 100 participants in France, 100 participants in the United Kingdom.
- Decision-makers with a budget of at least €100,000/year.
- Working in companies with more than 100 employees.
- Occupying their job in one of the following areas: digital, marketing, UX, innovation, customer experience, e-commerce.
We relied on an external panel and not on our client file so as not to bias the results with people too close to UX.
More than 80% of decision-makers are in organizations that work on UX
This simple figure is already a major lesson. More than 80% of respondents indicated that their company invests in user experience.
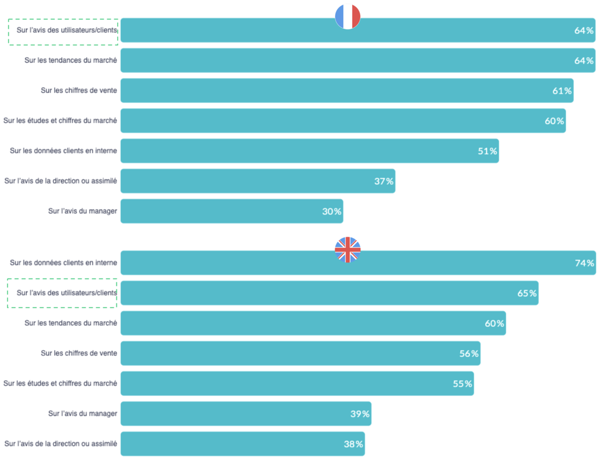
In addition, 65% of respondents consider that their company relies on the opinion of users/customers to make their decisions in terms of development:
In addition, 65% of respondents consider that their company relies on the opinion of users/customers to make their decisions in terms of development:
- This is the most cited criterion in France, on a par with market trends,
- And the number two criterion in the UK after internal customer data
Q7 - Today, on what criteria does your company make its development decisions? Base: 200 individuals
Overall, companies are tracking customer satisfaction and turnover
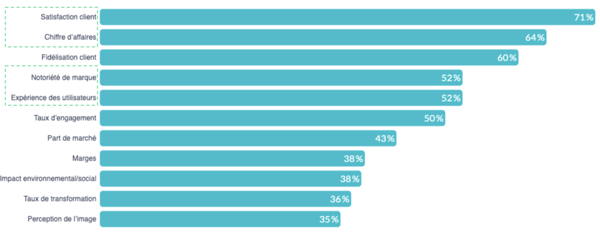
In terms of indicators now, according to the decision-makers surveyed, companies in France and the United Kingdom indicate that 71% track customer satisfaction and 64% track turnover as key indicators. Many other indicators were proposed, with user experience ranking 5th:
Q8 - What key indicators does your company track? Base: 200 individuals. Question asked to all
70% of companies that invest in UX saw their turnover increase in 2022
We asked respondents separately about the evolution of the different indicators and compared this with whether their company invests in User Experience.
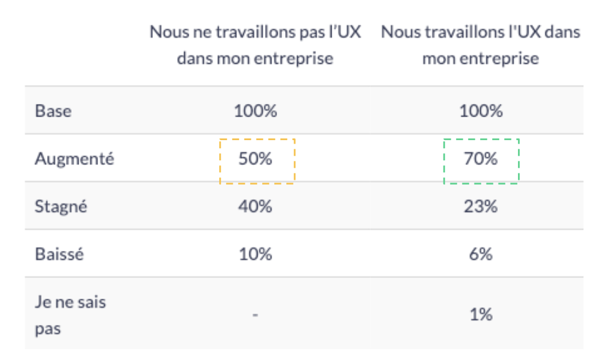
Turnover is 20% more likely to increase for companies that invest in the experience of their users.
Thus, 70% of companies that invest in UX saw their turnover increase in 2022, compared to only 50% for those that do not.
Q11 - User experience (UX) consists of focusing on the experience of a person interacting with a system, service or product, most often digital. In your company, is there any work done on user experience (UX)?
Base: 128 individuals
Q9 asked to those who selected the following answers: (Q8: "Transformation rate" is checked) OR (Q8: "Sales" is checked) OR (Q8: "Margins" is checked) OR (Q8: "Share market" is checked) OR (Q8: "Brand awareness" is checked) OR (Q8: "Image perception" is checked) OR (Q8: "Customer satisfaction" is checked) OR (Q8: "Experience of users" is checked) OR (Q8: "Engagement rate" is checked) OR (Q8: "Customer loyalty" is checked) OR (Q8: "Environmental/social impact" is checked)
Customer satisfaction 24% more likely to increase for companies that include UX budgets
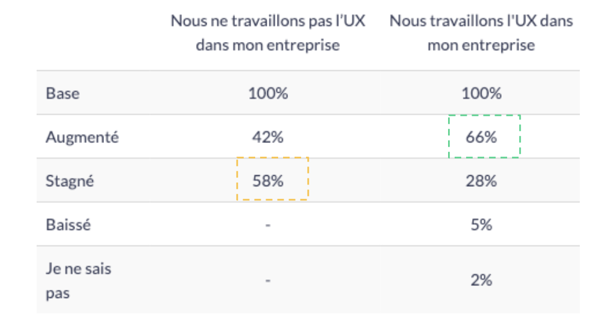
Customer satisfaction improved for 66% of organizations that focus on UX while it stagnated at 58% of organizations that don't.
Q11 - User experience (UX) consists of focusing on the experience of a person interacting with a system, service or product, most often digital. In your company, is there any work done on user experience (UX)? Base: 142 individuals
Q9 asked to those who selected the following answers: (Q8: "Transformation rate" is checked) OR (Q8: "Sales" is checked) OR (Q8: "Margins" is checked) OR (Q8: "Share market" is checked) OR (Q8: "Brand awareness" is checked) OR (Q8: "Image perception" is checked) OR (Q8: "Customer satisfaction" is checked) OR (Q8: "Experience of users" is checked) OR (Q8: "Engagement rate" is checked) OR (Q8: "Customer loyalty" is checked) OR (Q8: "Environmental/social impact" is checked)
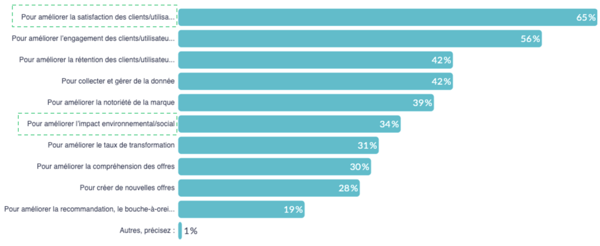
Customer and user satisfaction is the first cited benefit of such an investment.
The user experience makes it possible to improve the satisfaction of their customers/users for 65% of the decision-makers who participated in the study in France and in the UK. Among all the other proposals, one of them caught our attention. According to the respondents, only 28% of organizations see an impact of UX to create new offers. Empirically, at Ferpection, we see a huge impact in integrating user research for any company looking to innovate, as shown by this case study of the launch of a new offer for SANEF motorways.Q12 - We would now like to measure the place of UX in your company. Why does your company work on UX? Base: 175 individuals. Question asked to those who selected the following answers: (Q11: "We work on UX in my company, but not in my team" is checked) OR (Q11: "We work on UX in my team, but not me" is checked) OR (Q11: "I work on UX as part of my missions" is checked)
Sustainability and UX for Good are making progress
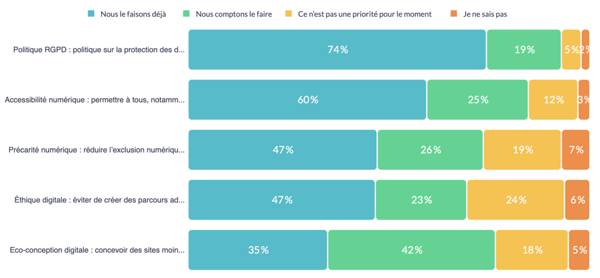
According to the respondents, 3 out of 4 companies have seen their environmental / societal indicators improve, almost independently of their investment in UX. When looking in more detail at responsible digital topics, two salient points emerge:
- On the one hand, the GDPR policy is practically in place, with 74% of respondents stating that their company already does so. However, we can wonder about the remaining 26%. To a lesser extent, this percentage is 60% on digital accessibility topics.
- For the future, the major construction project seems to be that of digital eco-design: 42% of decision-makers say that their company intends to do so.
Q20 - In your company, what actions with an environmental and/or social impact are implemented on digital subjects? Base: 175 individuals. Question asked to those who selected the following answers: (Q11: "We work on UX in my company, but not in my team" is checked) OR (Q11: "We work on UX in my team, but not me" is checked) OR (Q11: "I work on UX as part of my missions" is checked)
Increasing UX budgets
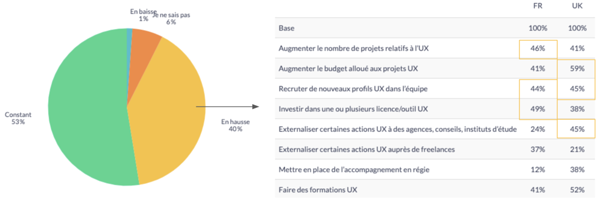
In the end, it is not surprising that, in 2023, 40% of the companies in the sample declare increasing the budget devoted to UX:
- In France, this increase is primarily used to increase the number of projects related to UX.
- In the UK, the first step is to increase the budget allocated to UX projects themselves.
Q16 - How will your UX budget evolve in the next 12 months? Base: 175 individuals. Question asked to those who selected the following answers: (Q11: "We work on UX in my company, but not in my team" is checked) OR (Q11: "We work on UX in my team, but not me" is checked) OR (Q11: "I work on UX as part of my missions" is checked)
Limitations and considerations for a future study
It is always good to question the results of a study. We have already mentioned the two salient elements that are here again:
- The fact that revenue and customer satisfaction increase more for companies that invest in UX indicates correlation but not necessarily causation. Is it this investment in UX that allows the increase in turnover? Probably not 100% but it seems to help. To go further, we could look at the evolution in detail of certain indicators, such as conversion, but they would then not be comparable, from one sector to another for example.
- The share of companies investing in UX is significant, and our segment of companies not investing in these topics turned out to be lower than our forecasts. In a future study, we would like to be able to increase the size of this segment, while bringing granularity to the question asked in order to better contextualize the answers obtained.
Want to know more?
Our quantitative study on the Return On Investment of UX provides more granularity on the comparison between France and the UK, information on the organization of UX teams, the methodologies they favor, etc. Do not hesitate to contact us to learn more and to find out how UX will improve the performance of your business.
All articles from the category: User research | RSS
